

Mario Vinasco, Marketing Analytics & Data Science at Uber Technologies, shares his tactics for marketing spend optimization using PyTorch machine learning.
Mario Vinasco, Marketing Analytics & Data Science at Uber Technologies, shares his tactics for marketing spend optimization using PyTorch machine learning.
Mario Vinasco, Marketing Analytics & Data Science at Uber Technologies, shares his tactics for marketing spend optimization using PyTorch machine learning.
Mario Vinasco, Marketing Analytics & Data Science at Uber Technologies, shares his tactics for marketing spend optimization using PyTorch machine learning.
In my last project at Uber Technologies I helped the performance marketing teams to allocate their investment across digital and offline channels around the world for Uber’s business units: Drivers, Riders, and Eaters.
Uber spends hundreds of millions of dollars in marketing around the world every year and therefore any improvement in the efficiency of the allocation of this money represents substantial gains, either money saved or more acquisitions and re-engagement of existing users.
The allocation problem is mathematically complex and difficult to solve computationally. Modern tools such as PyTorch help with the implementation and deployment of these type of models.
If money is spent in a digital channel ad, for example, Facebook or Craigslist, you would expect to attract customers, generate sales or in the case of Uber motivate people to take a trip or become a driver.
How much gain in your KPI can you attribute to your marketing spend?
This is a non-trivial question and there are methodologies like multi-touch attribution and media mix modeling that help answer that question.
This article describes the process of allocating money once the attribution has been done. In other words, once the relative efficiency of the different marketing channels is established, what is the best way to spend the money across them.
Uber spends hundreds of millions of dollars in marketing around the world every year and therefore any improvement in the efficiency of the allocation of this money represents substantial gains, either money saved or more acquisitions and re-engagement of existing users.
Optimization is the process of allocating resources (usually money) under constraints in order to maximize (or minimize) an outcome.
This is typically a problem of low data volumes and lots of parameters:
- Coefficients, that represent the channel efficiency or cost curves
- Trend terms to account for organic and seasonal trends
- Ad Stock for lag effects of advertising
The ’Cost Curves’ show that the efficiency of any marketing channel diminishes as the investment is made larger (law of diminishing returns).
A simple procedure is to invest in each channel until the marginal number of trips is less than the next channel and repeat across all channels.
The challenge starts when there are different cities and multiple time frames to optimize; in those cases, the number of data points to optimize is the product: number of cities times number of channels times number of time periods!
This no longer can be done via ‘eye’ optimization and requires a solver.
The solver takes the cost curves and aggregates them to calculate a total number of trips across all channels and cities; the solver finds the best allocation of money that maximizes that number by iterating and performing gradient ascent!
Specifically, we use PyTorch as the calculation engine and IPOPT as the solver.
PyTorch is a high performance, distributed and feature-rich computing library created by Facebook. It has been gaining popularity since 2017 as it’s easy to learn and perhaps easier to use than TensorFlow.
PyTorch provides two high-level features:
- Tensor computing (like NumPy) with strong acceleration via graphics processing units (GPU)
- Deep neural networks built on a tape-based autodiff system
PyTorch is best known for its ability to easily program and train neural networks, but we have also used it for optimization under constraints. In this case, PyTorch performs the calculations of the objective function or KPI and its gradients and then passes it to a solver to minimize or maximize a function.
For practitioners like me, PyTorch is not only a machine learning platform but a general-purpose computation library capable of large and distributed operations that also include gradient calculations.
PyTorch can be viewed as numpy (python numerical library) on steroids and can fully replace it.
As of 2019, the tool still has some bugs and needs to be carefully programmed. I had incidents where the logic and the math were correct but results were unexpectedly different due to rounding or operations between floating, double and integers.
For practitioners like me, PyTorch is not only a machine learning platform but a general-purpose computation library capable of large and distributed operations that also include gradient calculations.
Perhaps the most powerful feature of PyTorch is the inclusion of Autograd.
To solve iteratively a problem such as in machine learning or the minimization of a curve, the derivatives or gradients of such curve need to be calculated
The calculation of these gradients can be done analytically or numerically; the analytical calculations require the knowledge of the equations and this becomes difficult to code and scale. Traditionally, many solvers perform a simple numerical calculation based on finite differences to calculate the gradient. It requires the evaluation of the function at least twice:
In the case of large networks or complex functions, this calculation becomes very slow.
Automatic differentiation is a smart way to calculate the gradients using the chain rule of calculus; it requires the recording of every simple step of the execution of the calculation of the function of the KPI and its derivative at each step; these derivatives are known for simple functions.
Autograd, performs this recording and produces the final gradient automatically.
The following example illustrates a function that calculates a KPI based on marketing investment implemented in PyTorch:
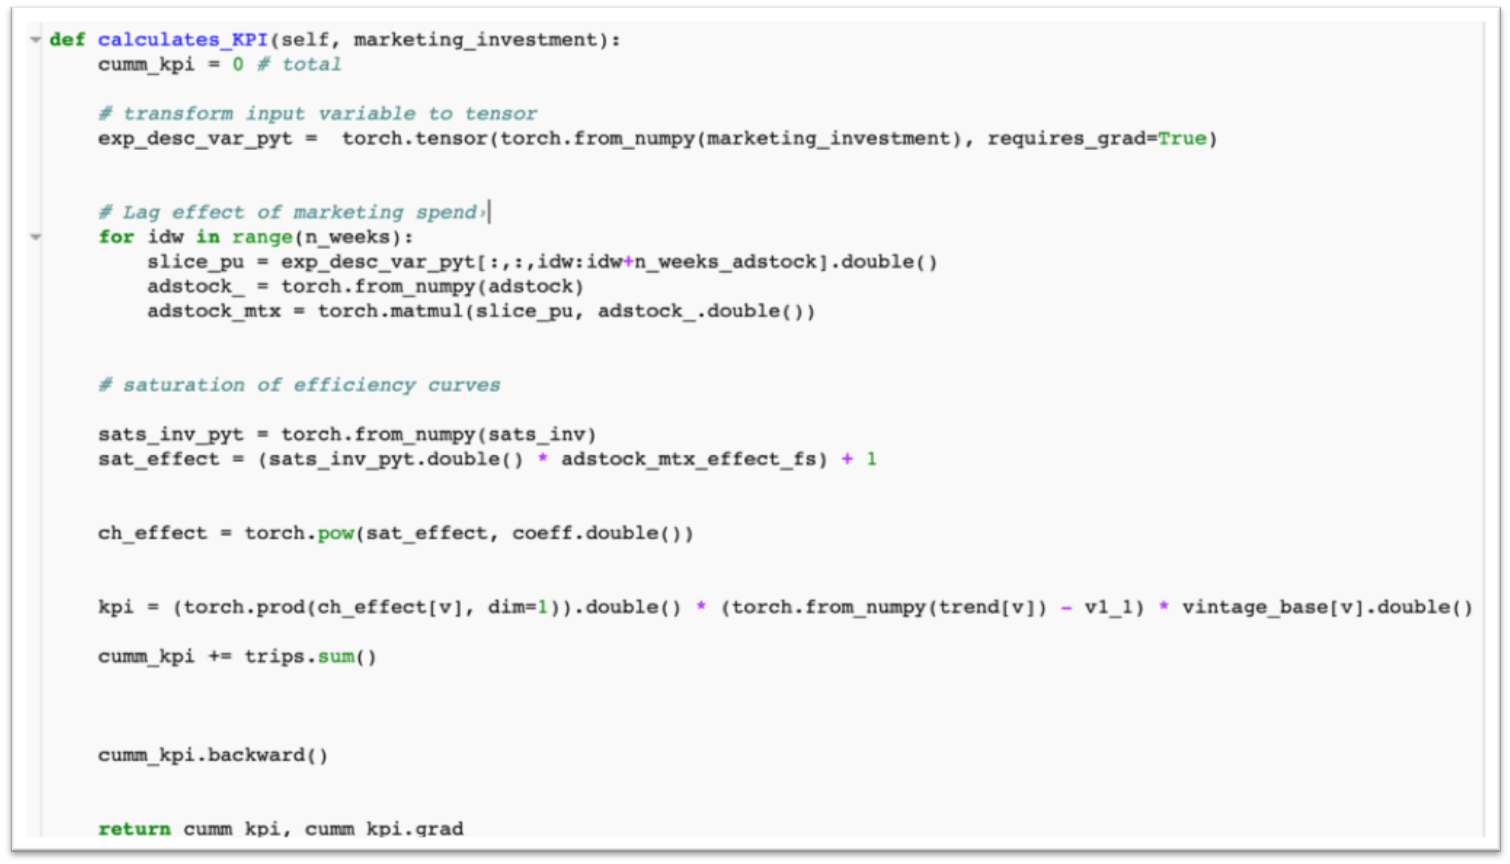
The code shows a transformation of the marketing investment variable (in matrix form) to a tensor that requires gradients.
It then performs matrix operations that introduce lag and saturation effects and computes the “KPI”, which in this case are Trips.
Up to this point, the math can be done in any library; we could have used numpy for example.
However, the line “cumm_kpi.backward()” performs the magic of calculating the gradients of the KPI with respect to each one of the elements of “marketing_investment”.
The charts below show hypothetical marketing spend scenarios in different digital channels and the number of trips that could be attributed to that spend:
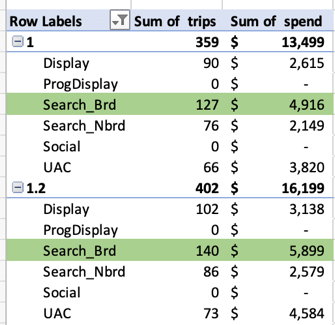
For example, spending $4916 in Search produces 127 trips; spending $5899 would produce 140.
The chart below shows the gradients of the number of trips with respect to spend in each digital channel in each week:
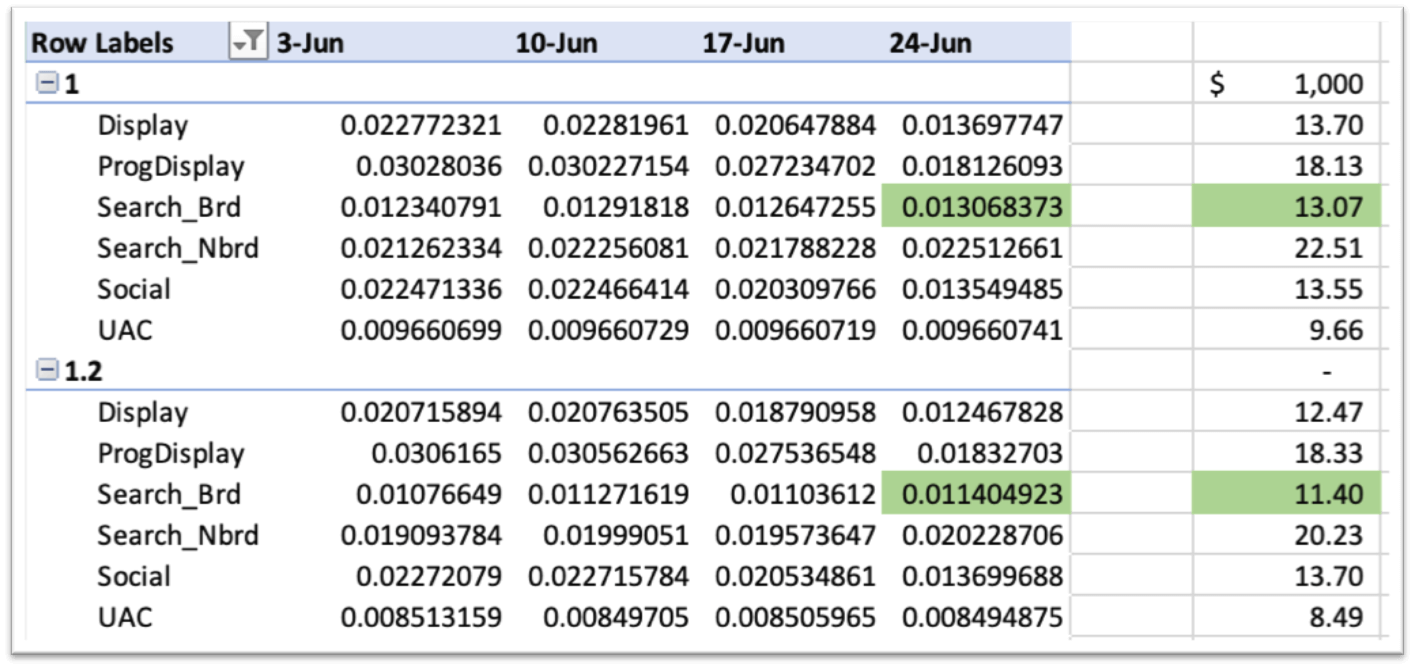
The way to interpret the gradients is as follows:
If we are in scenario 1, spending $4,916 in Search, we could expect an increase of 13 trips if we spend an additional $1,000.
However, if we are spending in scenario 1.2 (or 20% higher), and additional $1000 will bring an increase of 11 trips, showing the scale of diminishing returns!
Marketing spend optimization involves thousands of decision variables (spend per city, per channel, per week) across paid digital, offline, and referral.
Thanks to Pytorch and Autograd, we can solve this large allocation problem in minutes, allowing our performance marketers to run multiple scenarios easily.
Mario Vinasco is the Director BI and Analytics at Credit Sesame, and former Data Science and Optimization - Marketing Analytics at Uber. He has 15+ years of experience leveraging expertise in data analytics, database programming, and machine learning to support e-commerce, advertising, customer acquisition/retention, and optimization of marketing investments.