
Guides & Best Practices
How to optimize KPIs by distilling data with machine learning
This article shows how to activate web analytics data by modeling user propensity to add products to a cart. By distilling behavioral dimensions into a 0–100 score, marketers gain precise segmentation for targeting, personalized content, and improved bidding strategies. The distilled scores feed future models, creating a virtuous loop of data augmentation and KPI optimization.


Bridging business objectives and marketing data
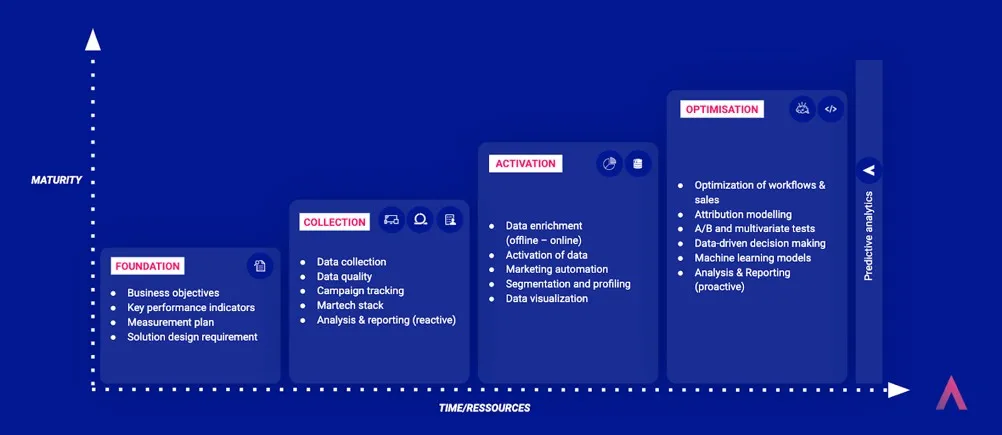
Too often, analysts struggle to align marketing KPIs with web analytics data. Without a clear measurement plan rooted in goals, data becomes reactive or worse, irrelevant. Google Analytics works best when events and goals are treated as strategic KPIs.
Once objectives are defined, most analytics setups stop at data collection and reporting. But why not use that data to proactively influence the behavior behind the KPI?
Distilling behavior to optimize marketing metrics
In this example, the objective is optimizing a lower-funnel event: add-to-cart actions. Using machine learning, behavioral data dimensions (e.g., pages visited, session durations, referral source) are distilled into a custom propensity score assigned to each client ID.
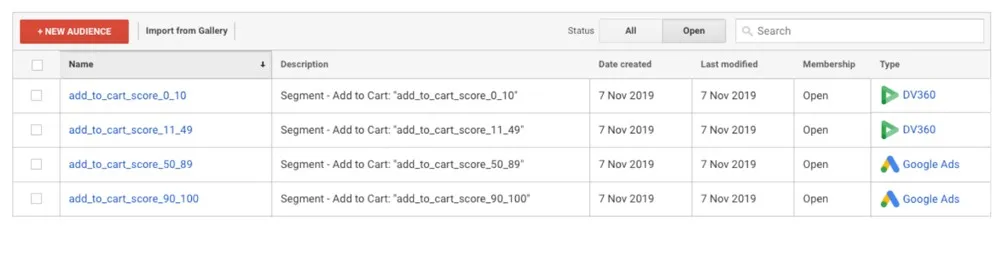
Users are segmented into score bands:
- 0–25: Very low propensity (exclude or analyze)
- 26–50: Low-to-mid propensity
- 51–75: Mid-to-high
- 76–100: High propensity (targeted in campaigns)
These segments feed bidding strategies and personalization workflows seamlessly.
Technical setup and model deployment
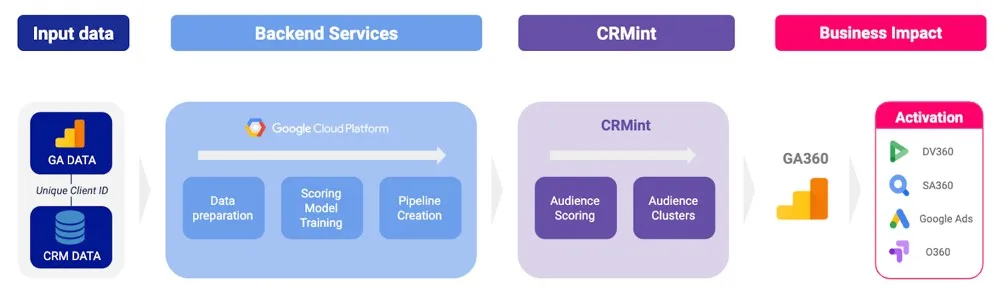
The tech stack is built on Google Cloud Platform (GCP), with Google Analytics 360 and CRM data joined in BigQuery. Key behavioral dimensions are selected to train a TensorFlow model via AI Platform. CRMint handles the data pipeline: integrating scoring with Google Analytics, DV360, Google Ads, and Optimize.
Notable features include reusable “workers” and a GUI for pipeline creation. Data flows automatically from ingestion to model training and audience creation, and custom dimensions are injected without requiring API scripting.
The marketing benefits of a propensity score distillate
With the custom propensity score dimension live in Google Analytics, marketers can:
- Use DV360 and Google Ads to bid on high-propensity audiences
- Create personalization rules in Google Optimize tied to propensity
- Inform content strategy by targeting users most likely to convert
Because the distillate becomes the foundation for subsequent machine learning models, the system evolves organically over time: sharpening both marketing activation and insight.
Sustainable data ROI and continuous improvement
With a well-architected setup and reusable code, the model’s break-even point can be reached within months thanks to more efficient ad spend and personalization. The data loop continues: each propensity model enriches the next, improving the granularity of future KPI optimizations.
About Robert Børlum‑Bach
Robert Børlum‑Bach is Head of Analytics Architecture at TV2 in Denmark, specializing in digital analytics, data governance, and machine learning-driven KPI activation.
FAQ
A propensity score is a custom dimension (0–100) that represents how likely a user is to complete a target action, such as adding a product to the cart.
Use Google Analytics 360 data and supplemental CRM data in BigQuery. Train a TensorFlow model, host it on AI Platform, and integrate scoring through CRMint, connecting the model output back into Google Analytics as a dimension.
Machine learning models can synthesize multiple behavioral dimensions into a single score, revealing patterns not visible through basic rules. This enables more precise targeting and personalization.
Segment users by score for campaign targeting, adjust bids based on likelihood to convert, and personalize content in Google Optimize based on behavioral propensity.
Each new propensity score becomes an enriched input feature for subsequent models, creating a continuous learning loop: improving insights and optimizing KPI outcomes over time.